The most time-consuming was the search and retrieval of the data used. When the data was then visible for the first time on a map, the difficulty lay in deriving meaningful
insights from the wealth of data and making them visible on the map. For this it was helpful to simply try out different techniques and observe the effects. This resulted,
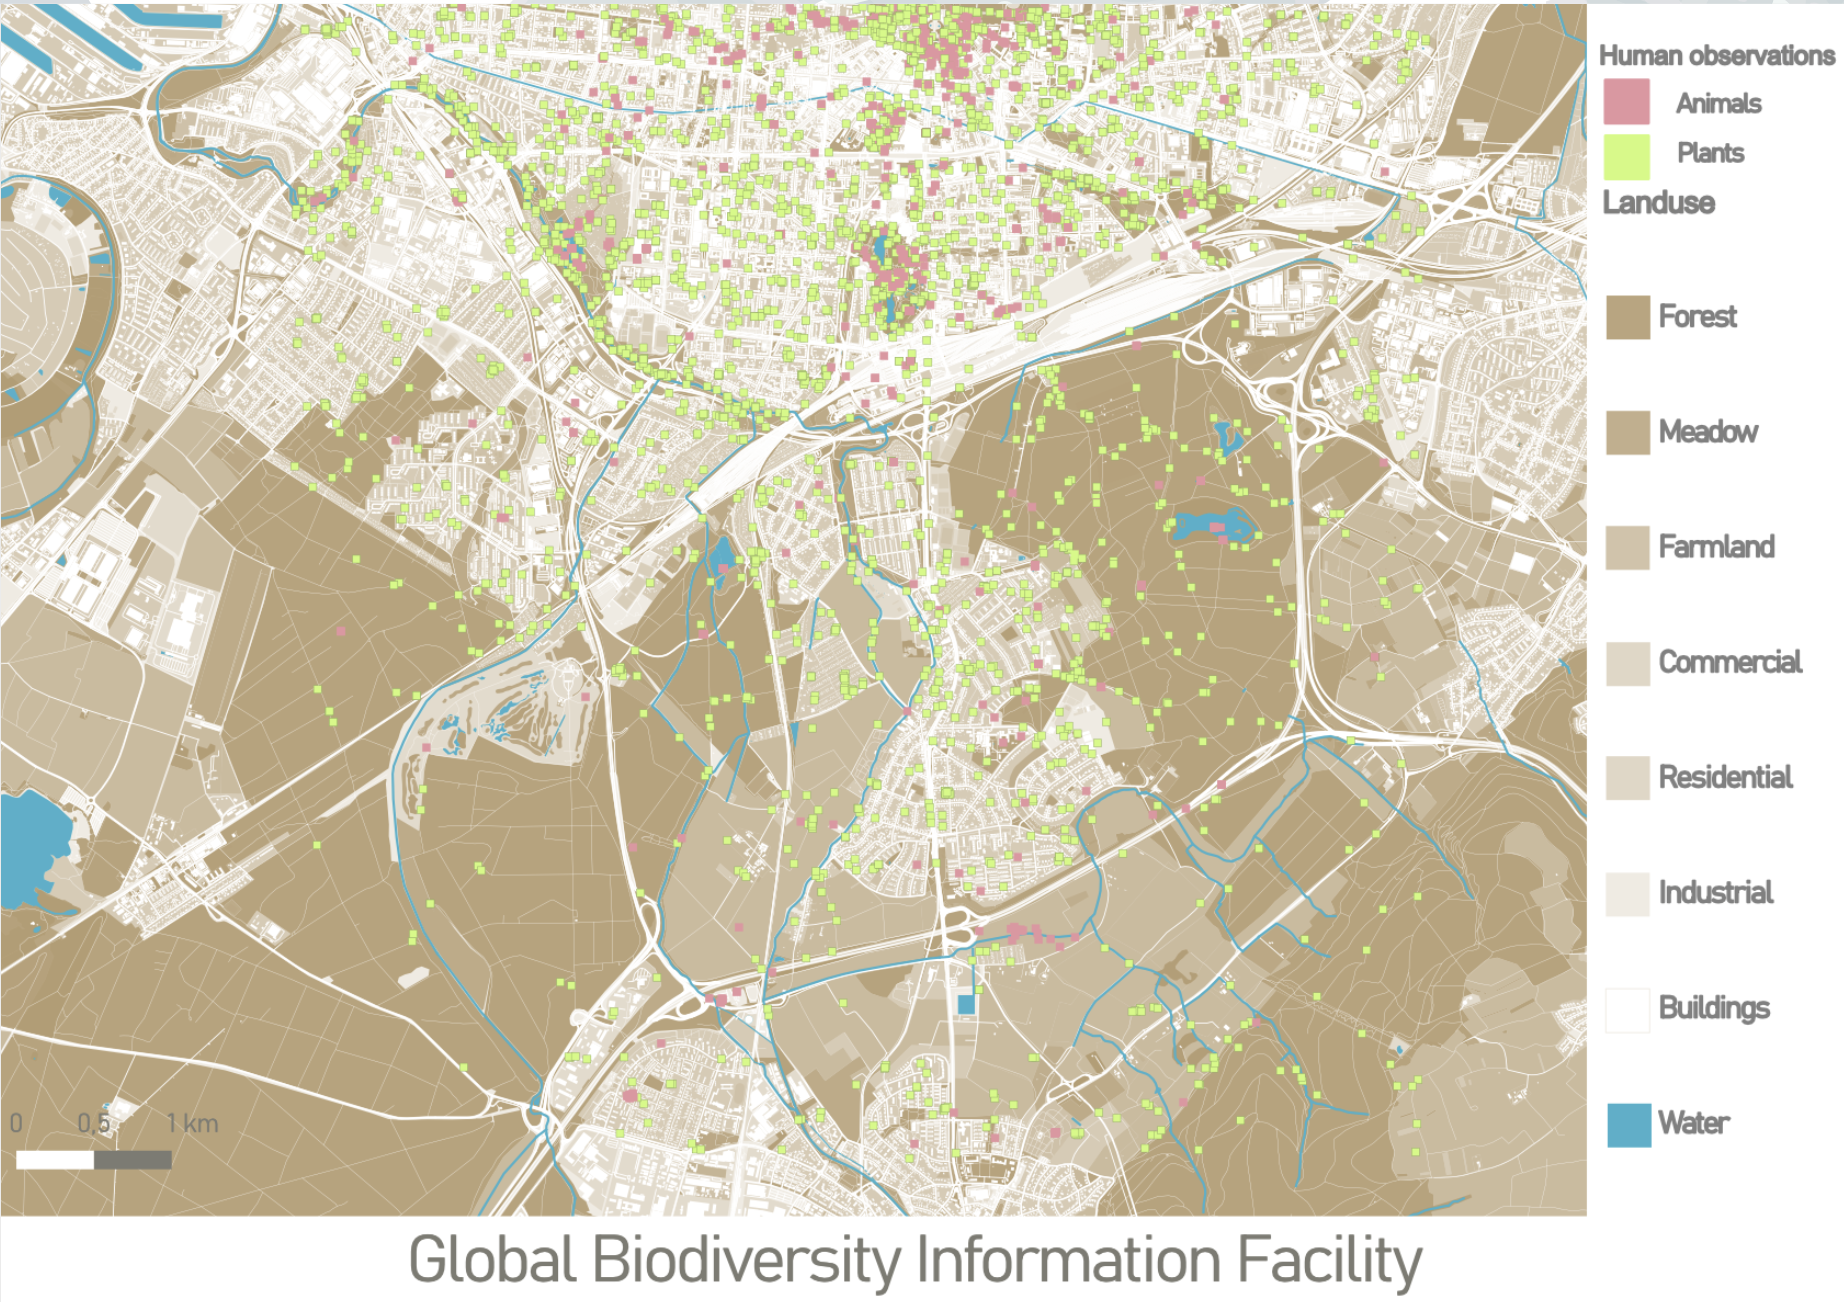
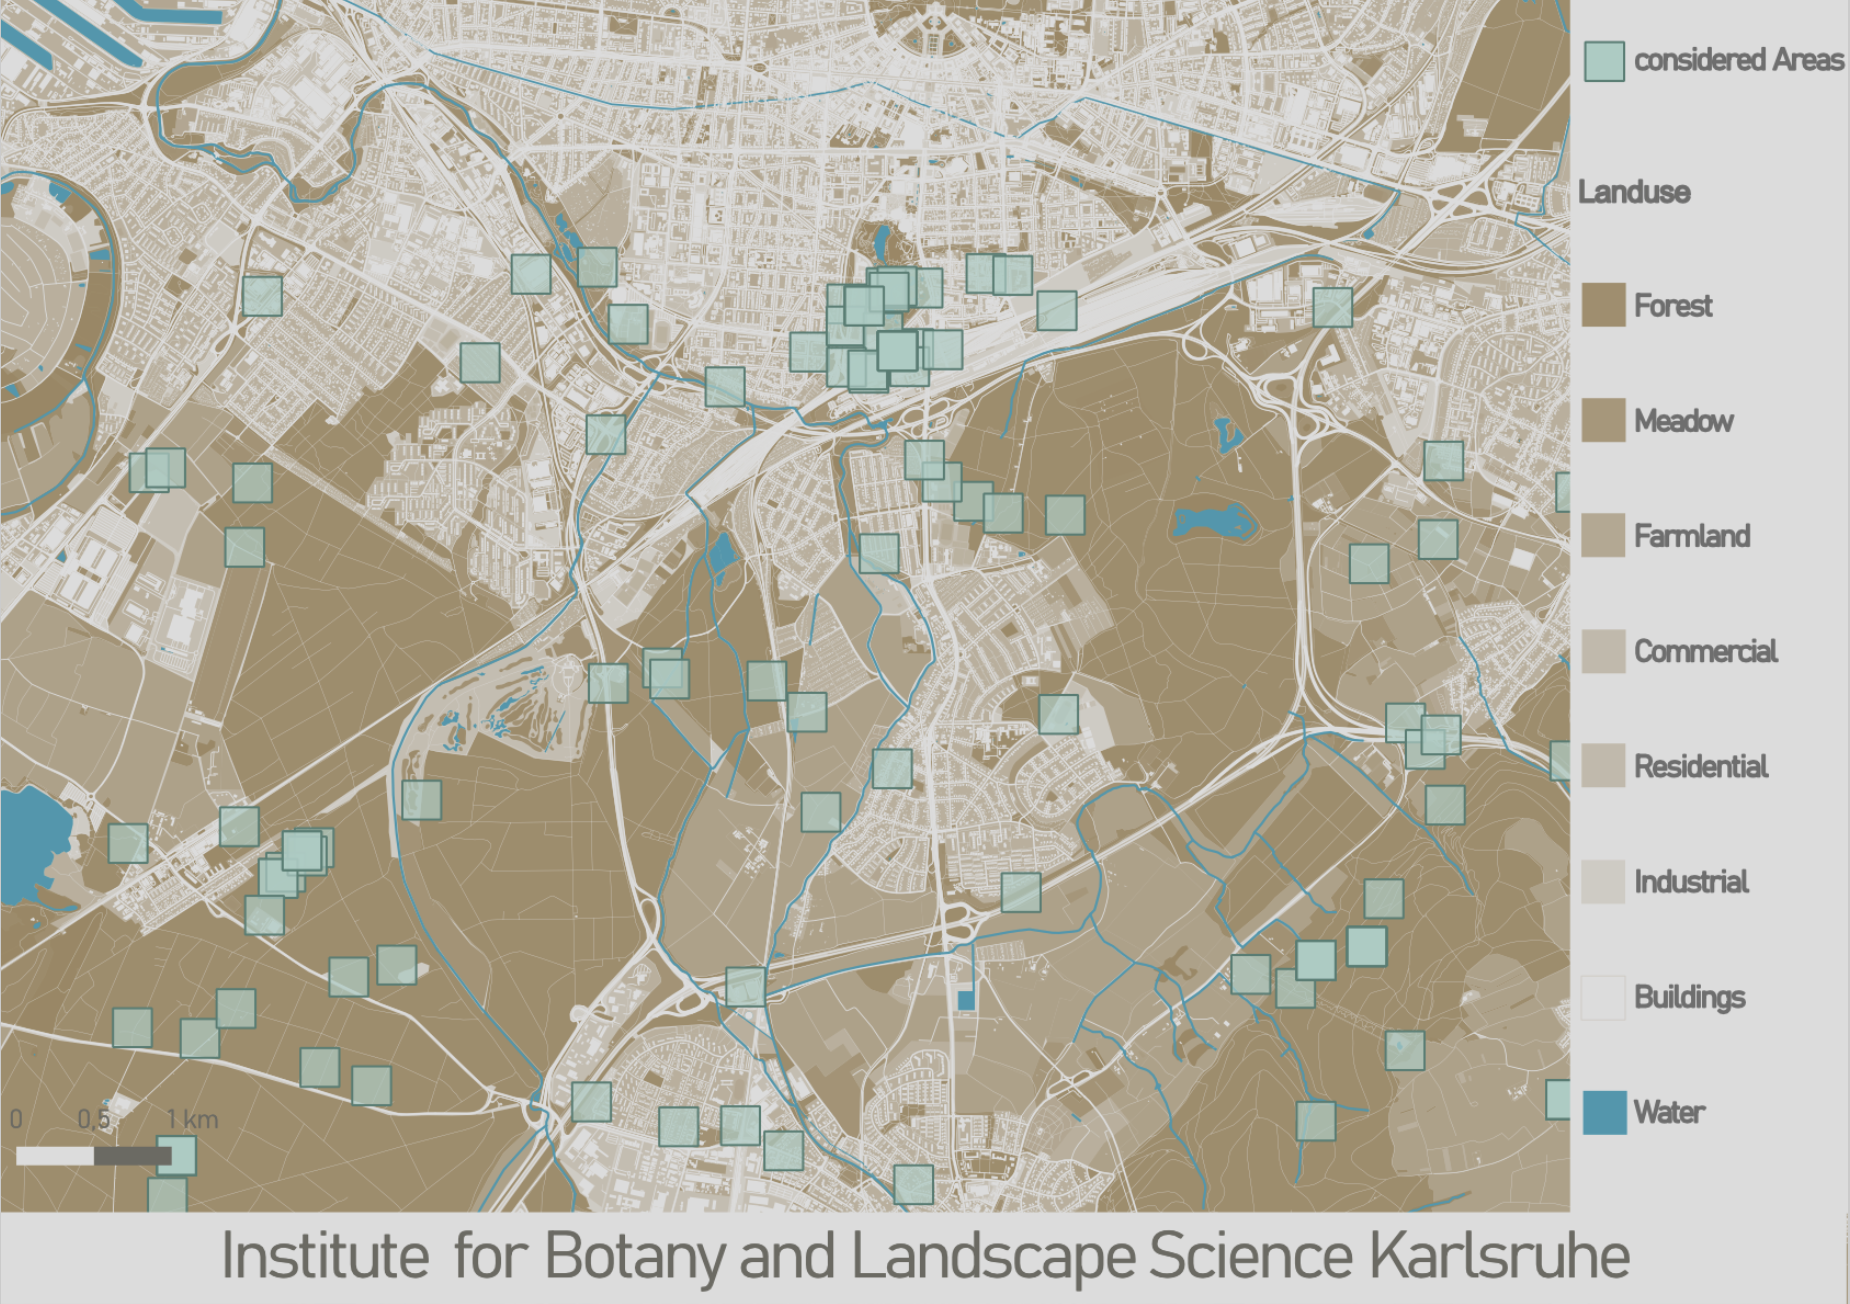
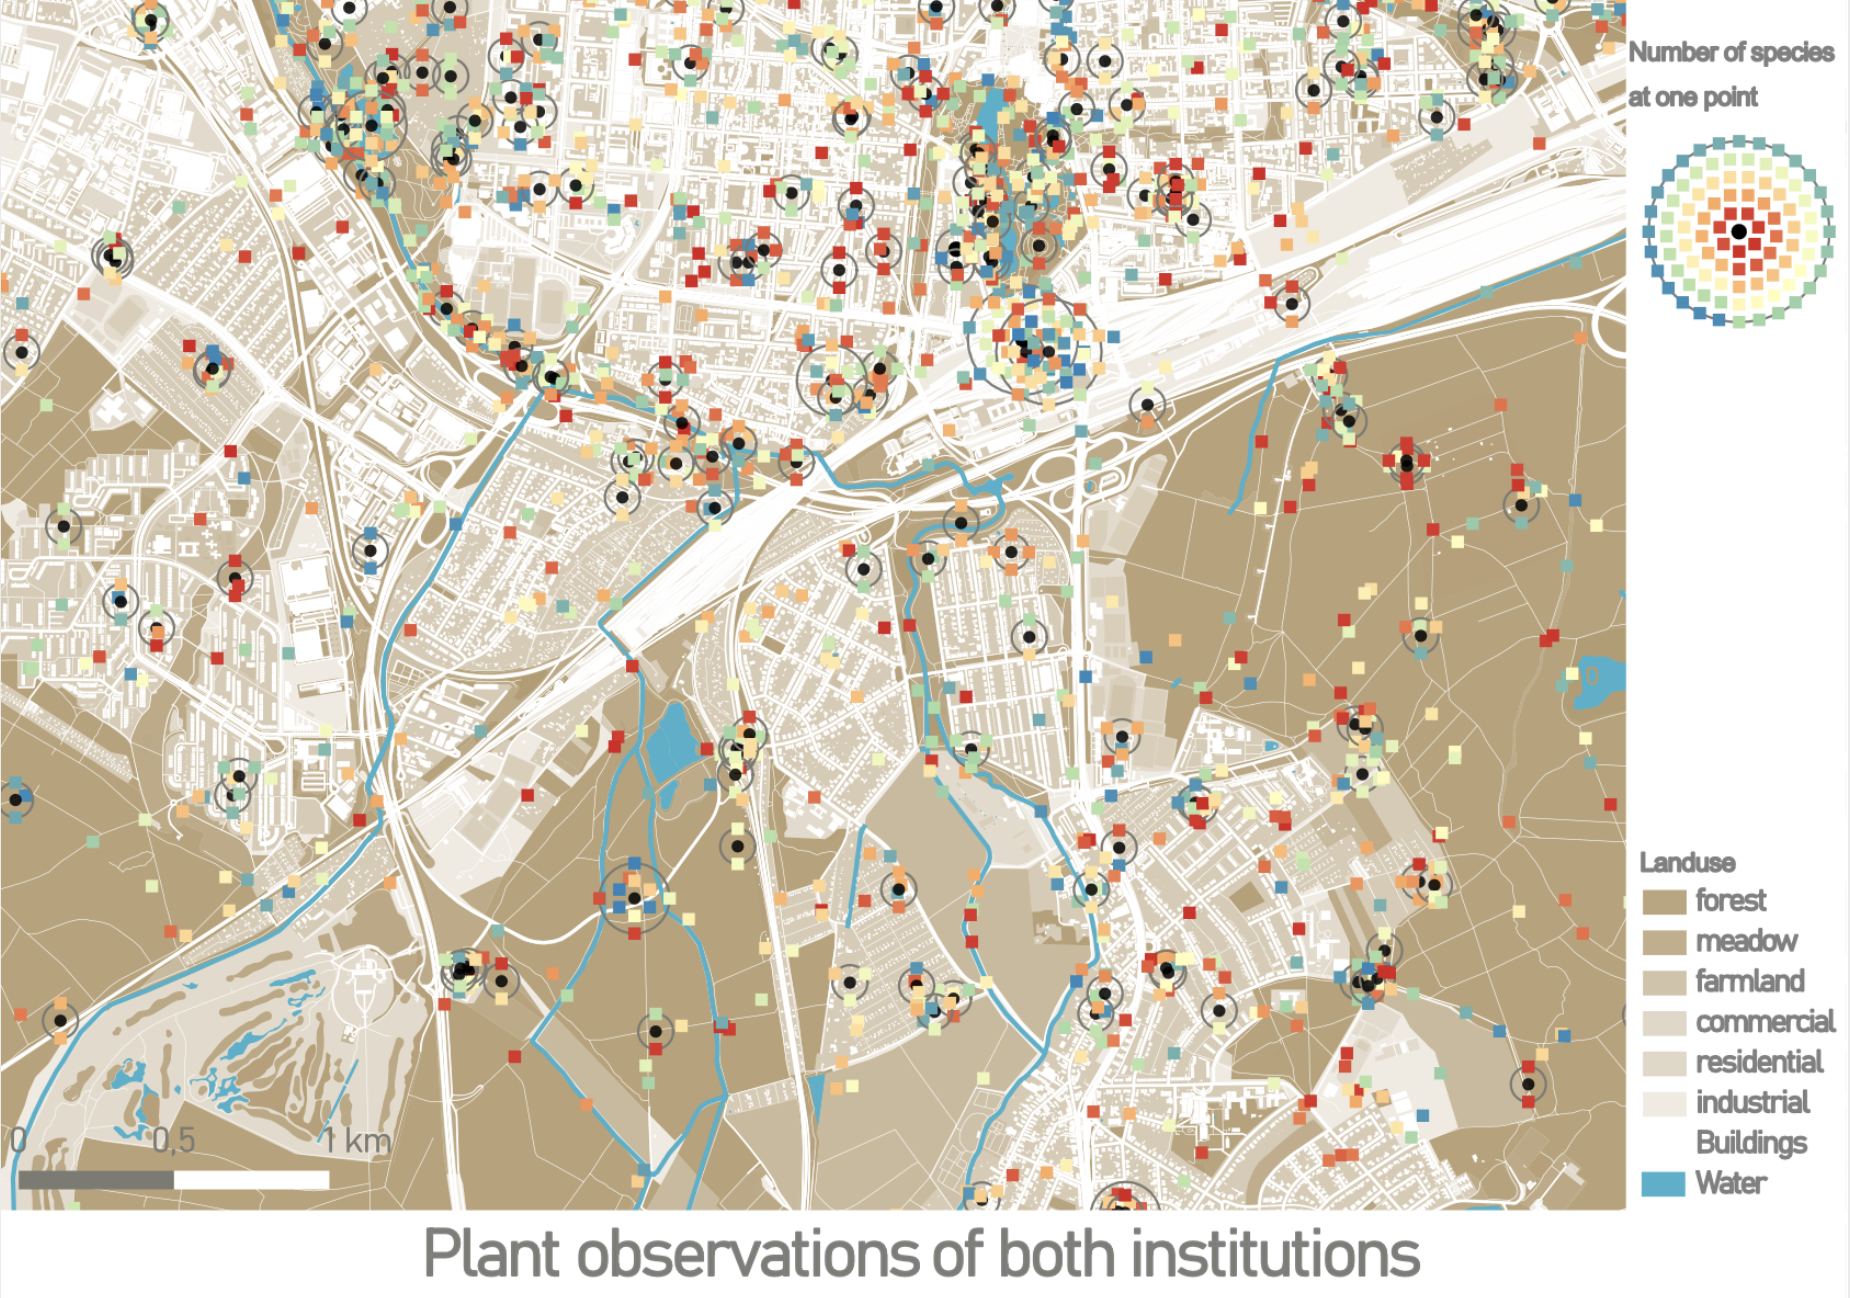
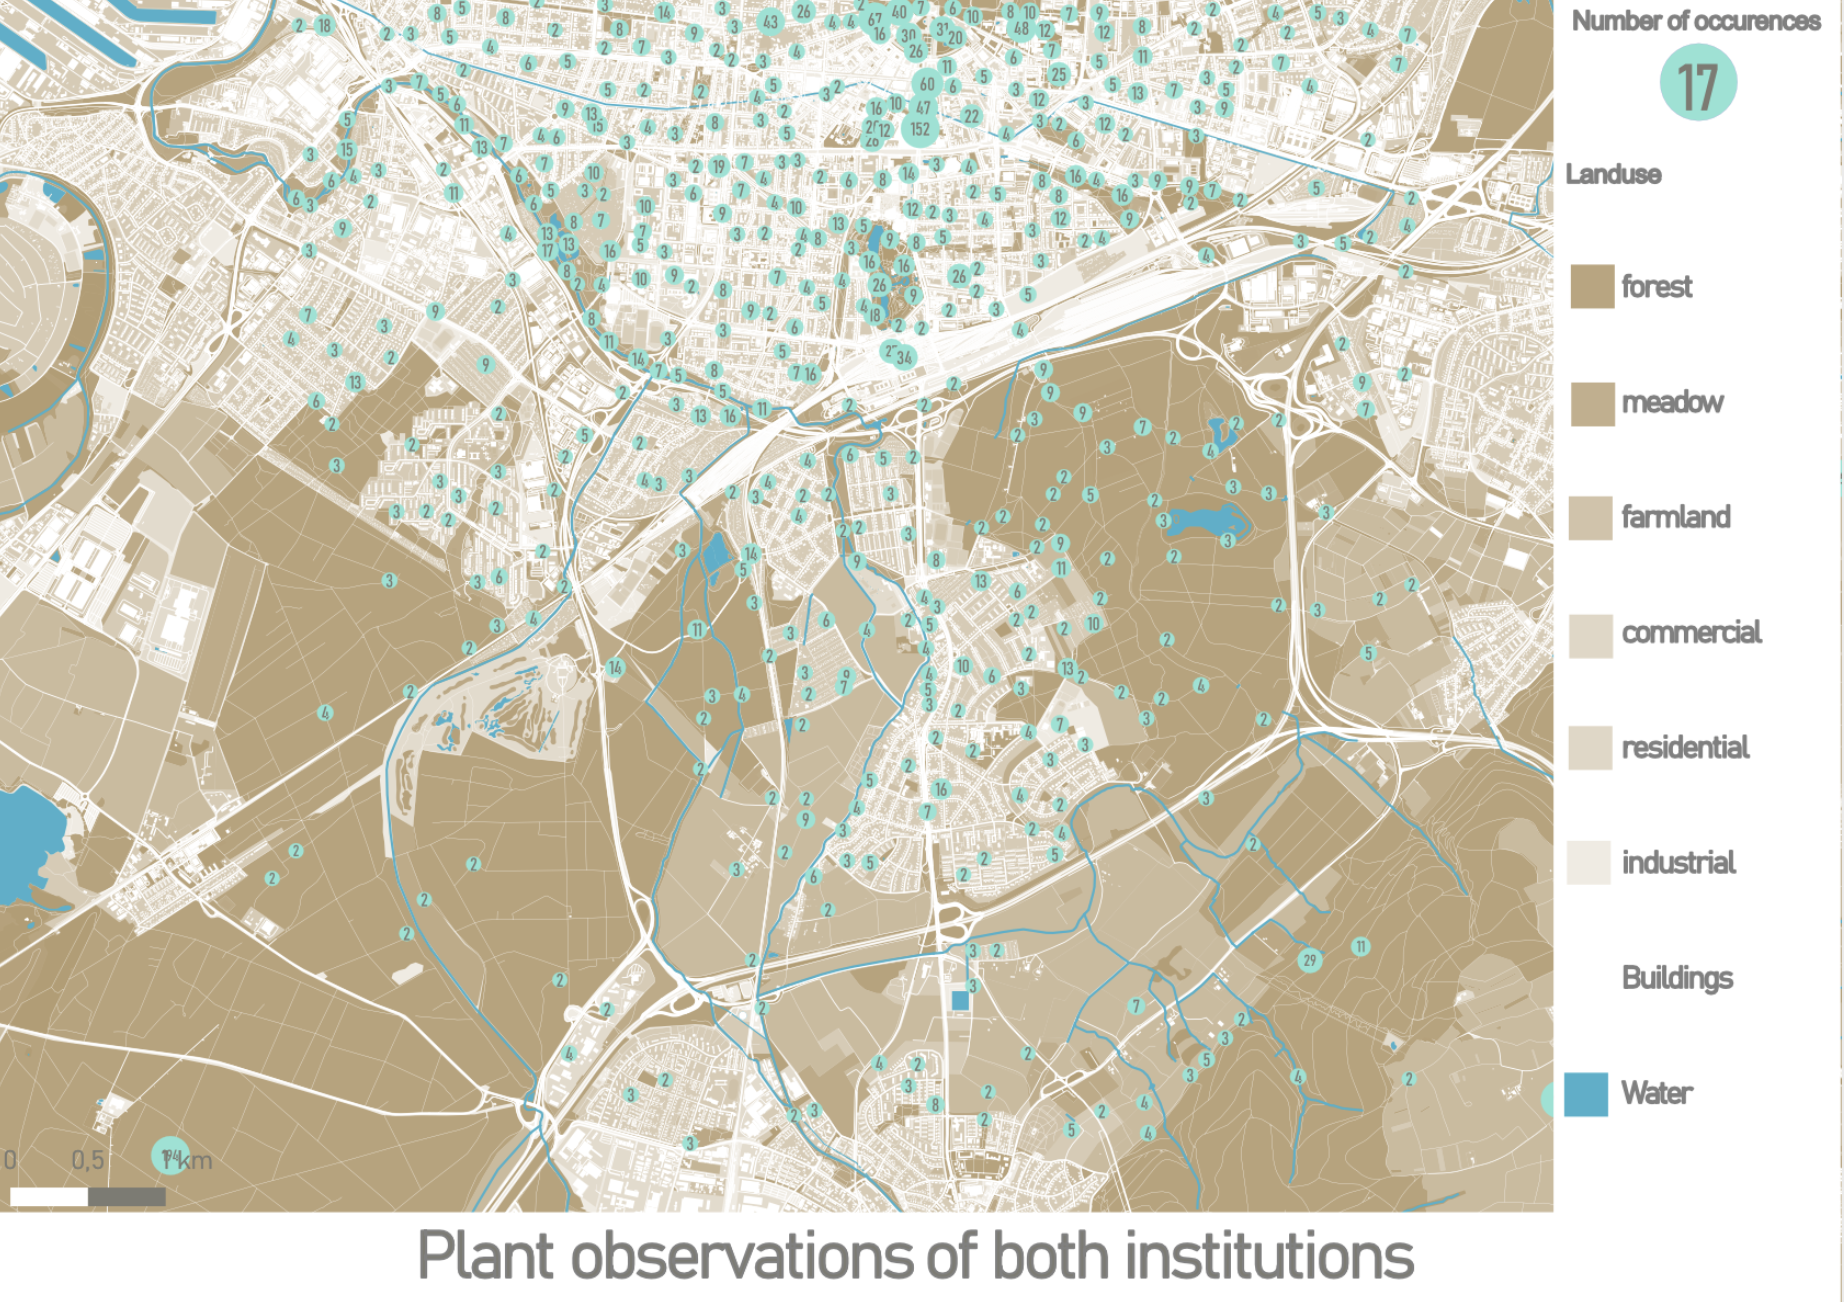
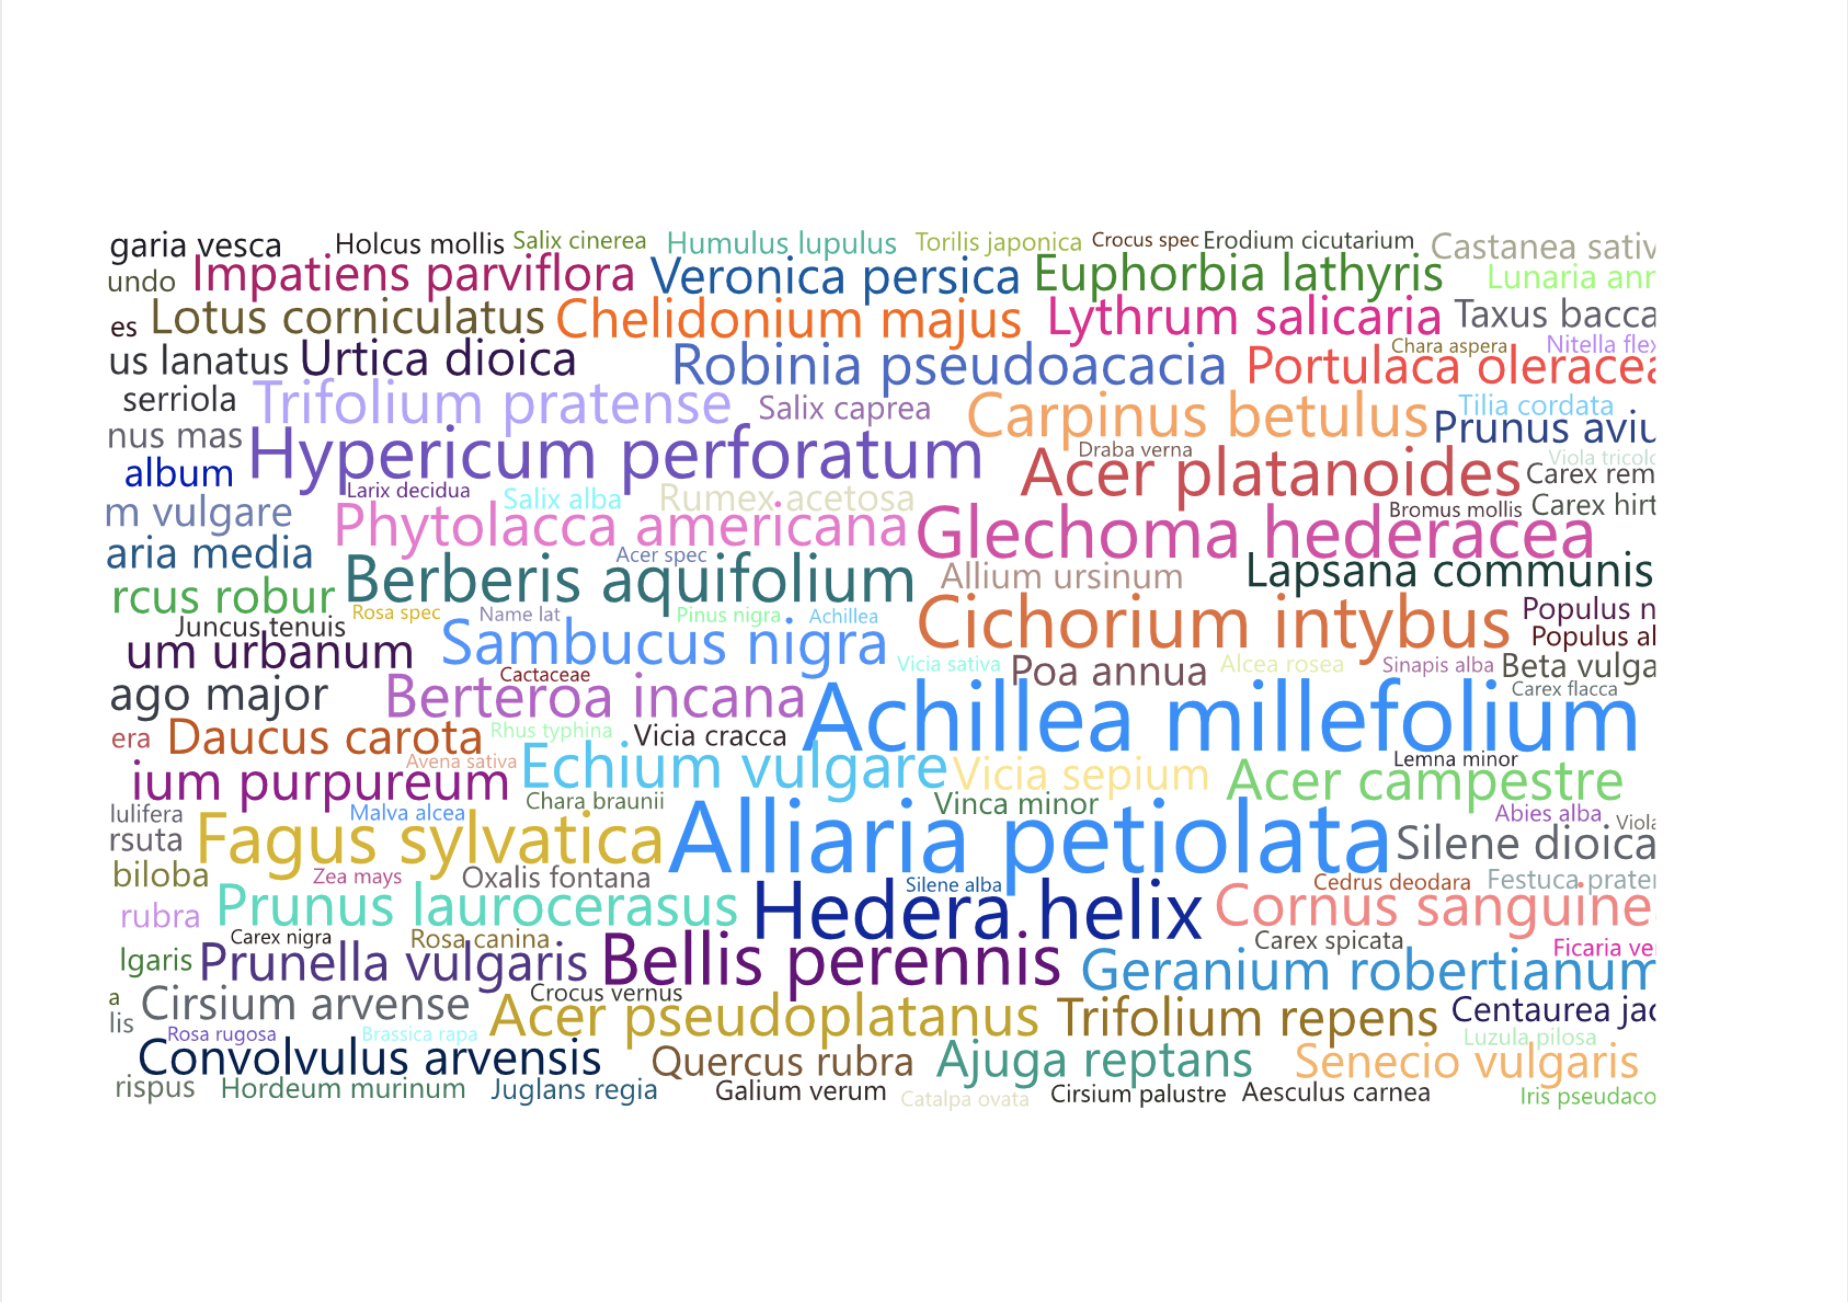
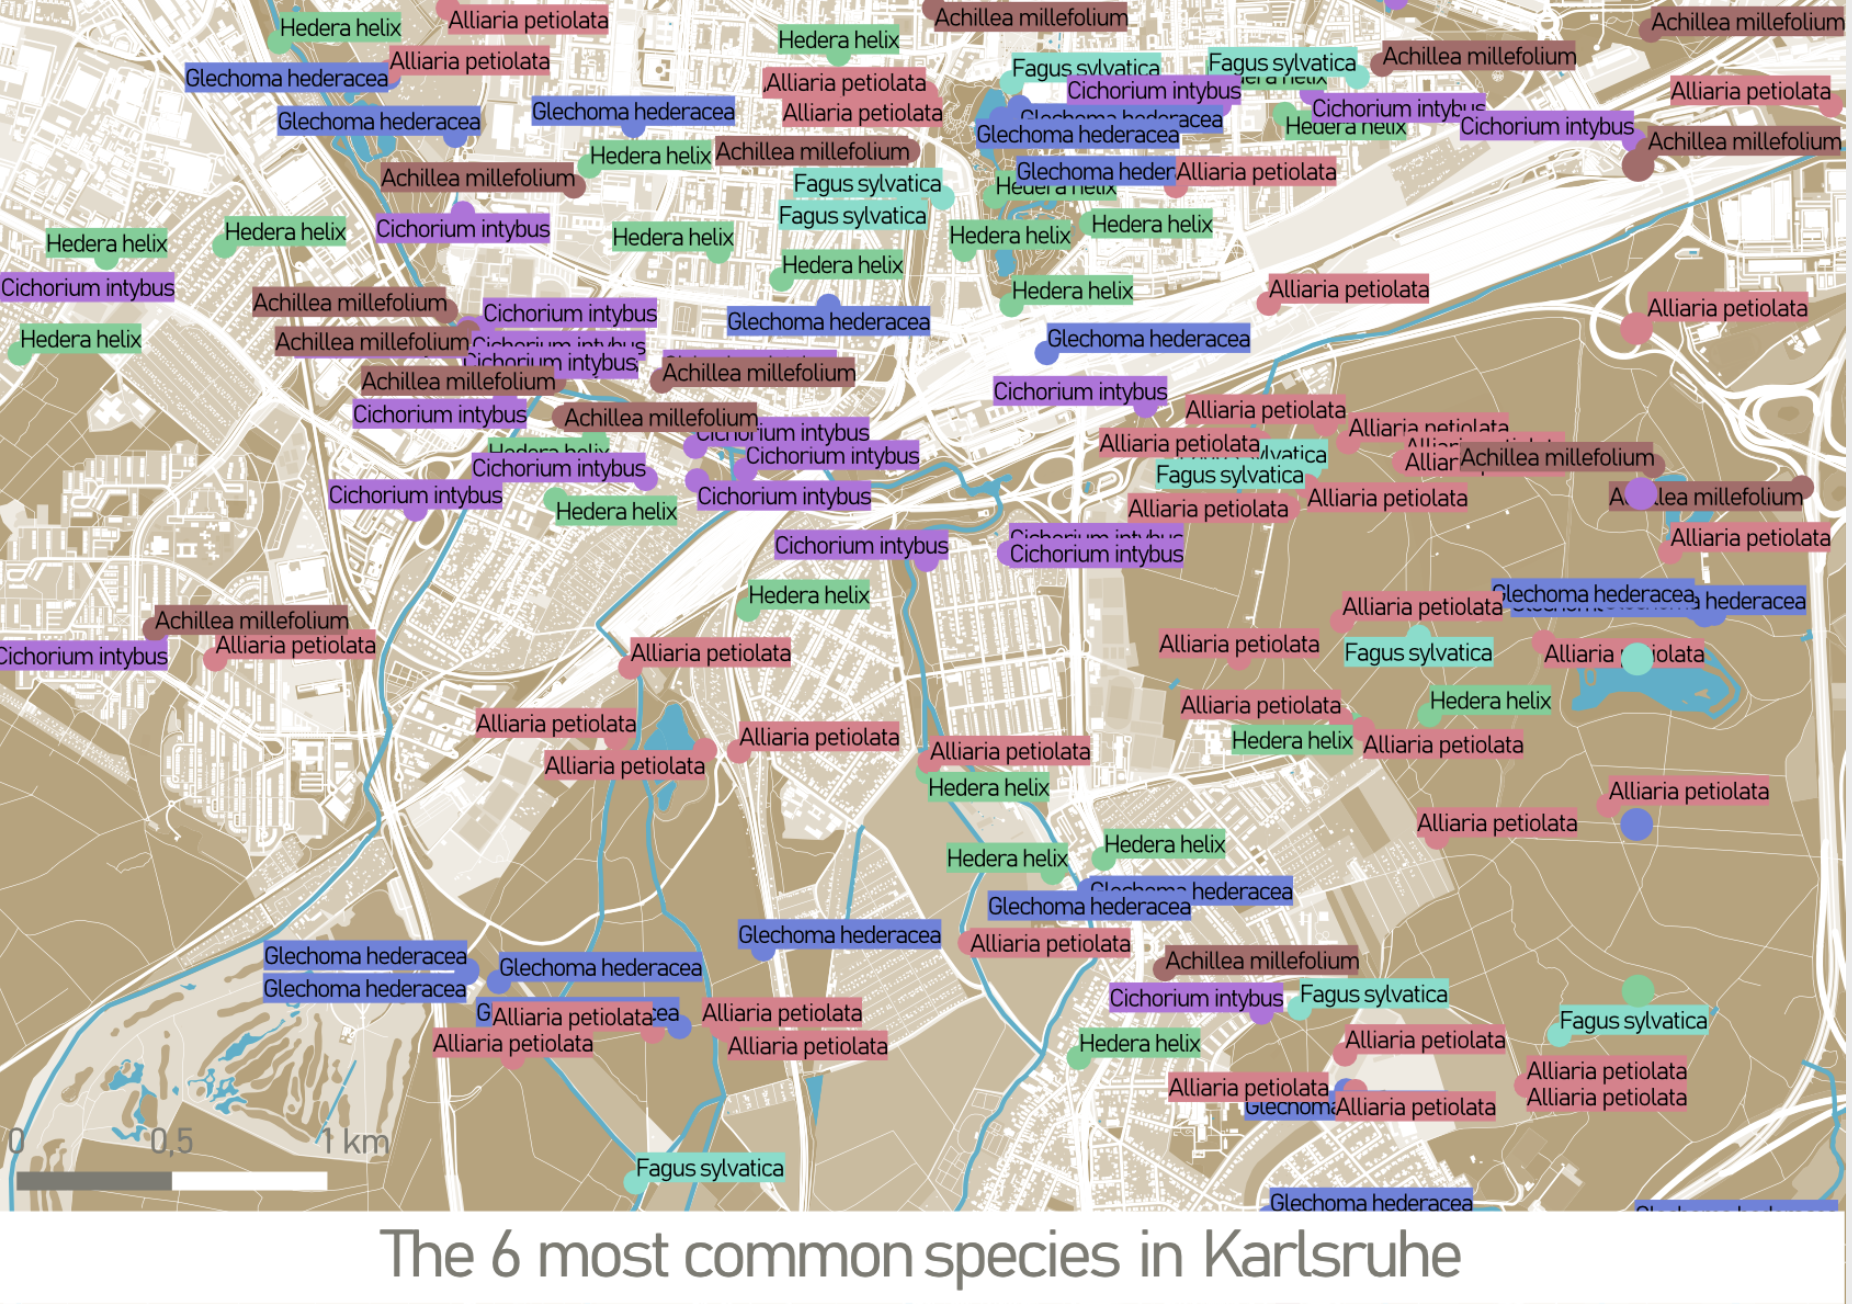
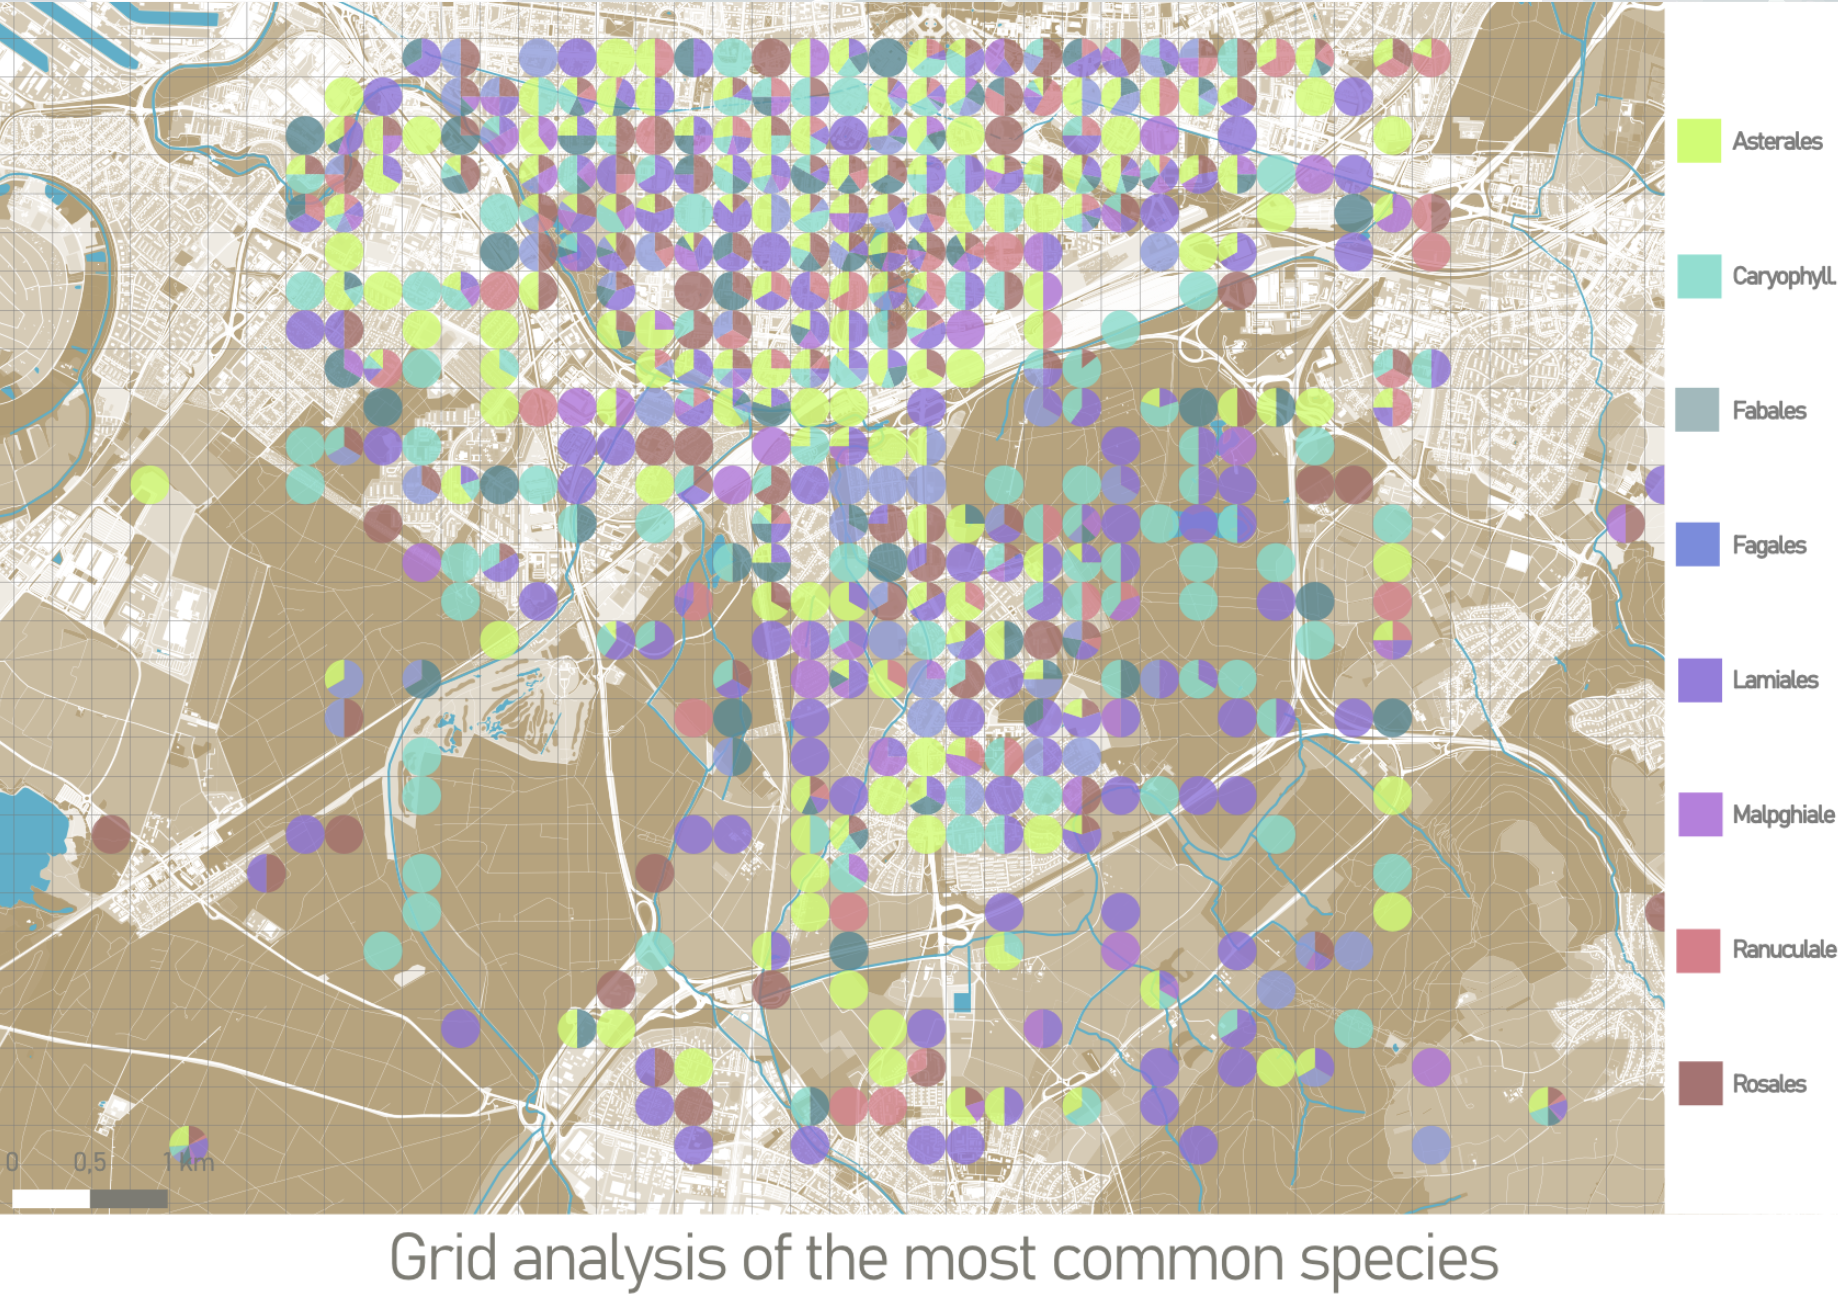
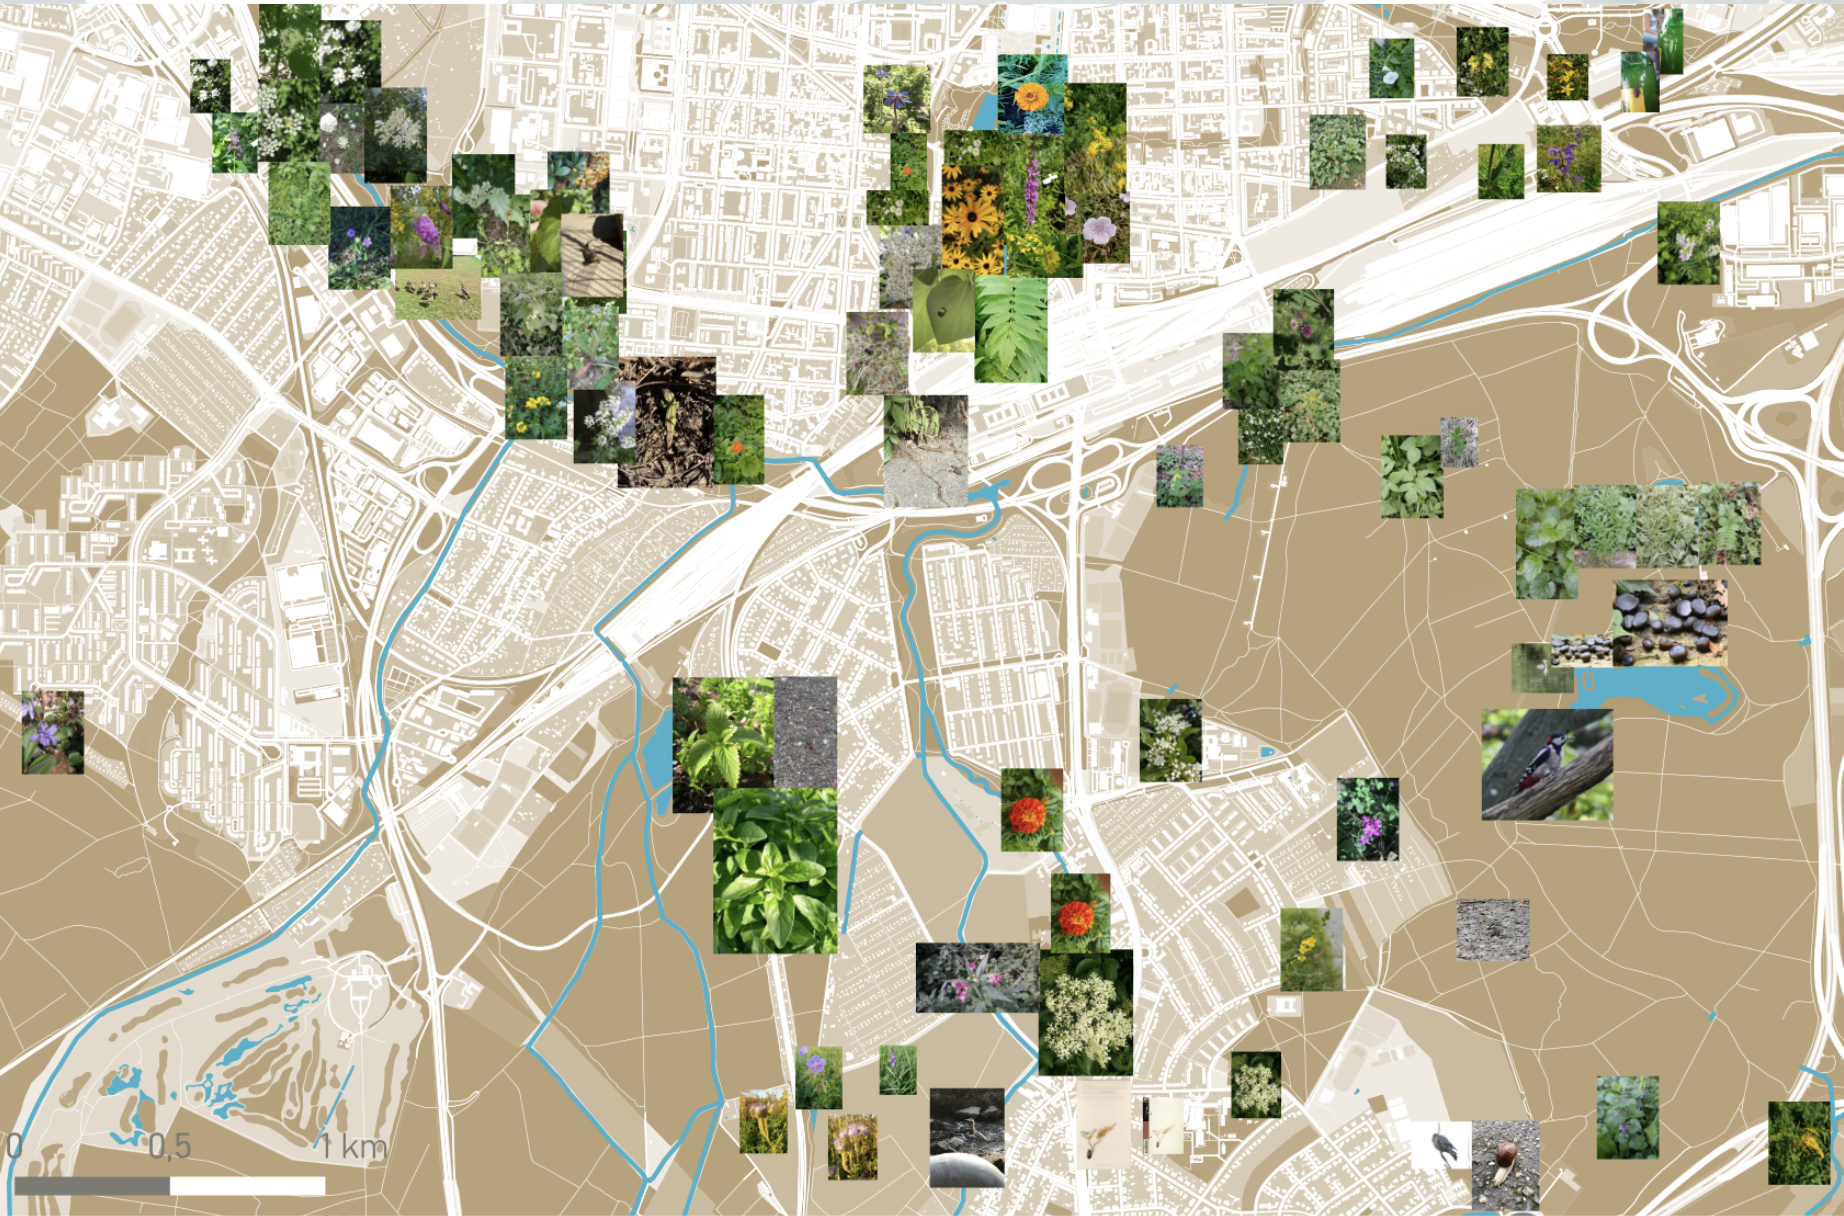
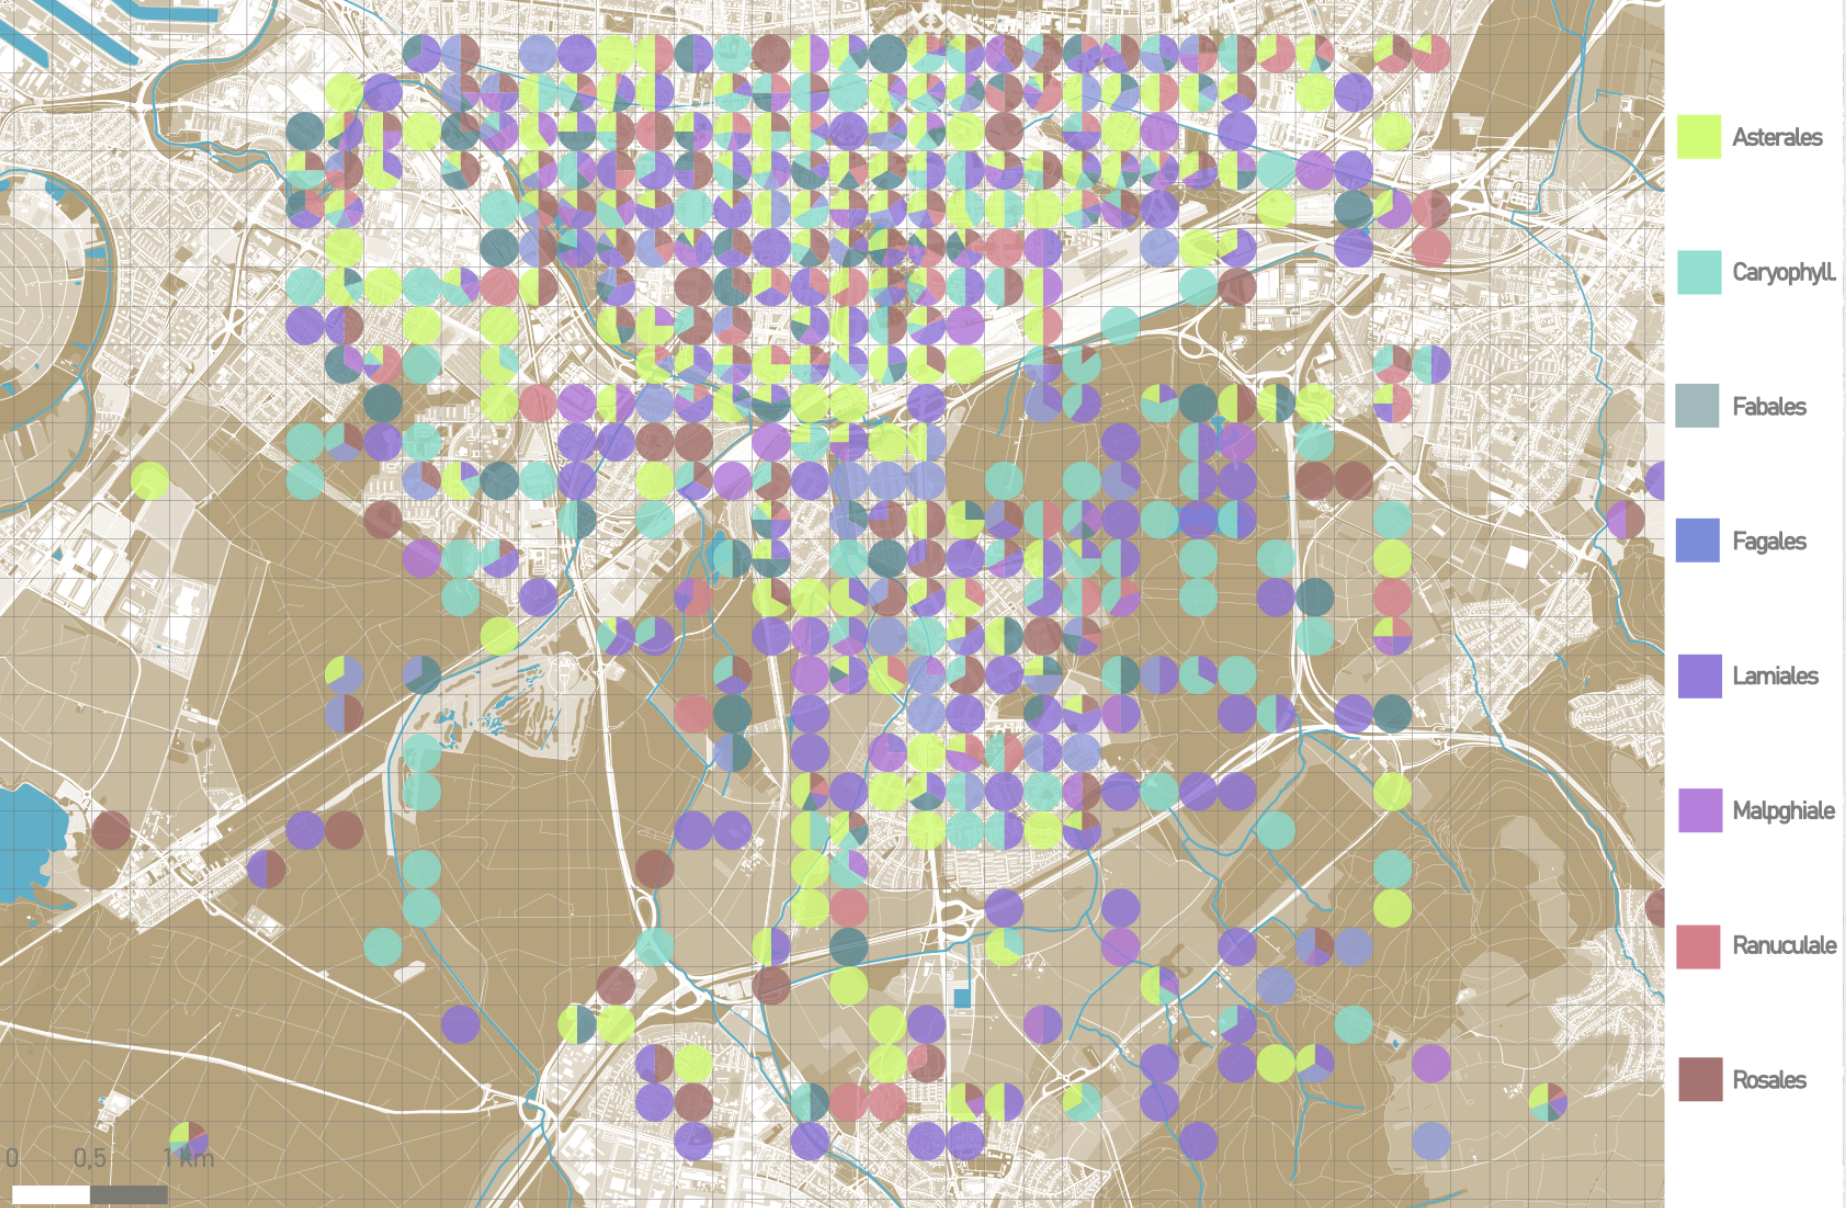
in a large number of different maps that made it possible to show different aspects of the distribution of plants in Karlsruhe. For example, it was possible to show how the dis-
tribution of the 6 most common plants changes within Karlsruhe.
These data could be used to draw conclusions about the soil composition. Another possibility would be to compare the data with existing soil data and thereby compare the adaptability of the plants. In the future, with more and more data and
faster updates, other aspects such as temporal distribution or the like
could also be investigated.